Anyone can list
capabilities. Here are the numbers.
Four worked examples. Each one shows the imagery, the figures derived from it, and how far those figures move when the thresholds move.
Automated mangrove cover and canopy loss in the Sundarbans
On this coast the mangrove is not cleared, it is drowned. Two post-monsoon composites five years apart, measuring canopy loss and land converted to water separately.
- Location
- Sundarbans, South 24 Parganas, India
- Area
- 17,269 ha mangrove at baseline (2019–20)
- Window
- Nov 2019 – Feb 2020 vs Nov 2024 – Feb 2025
- Sensors
- Sentinel-2 L2A · ESA WorldCover 2020
- Cadence
- 64 scenes composited, median gap 3 days
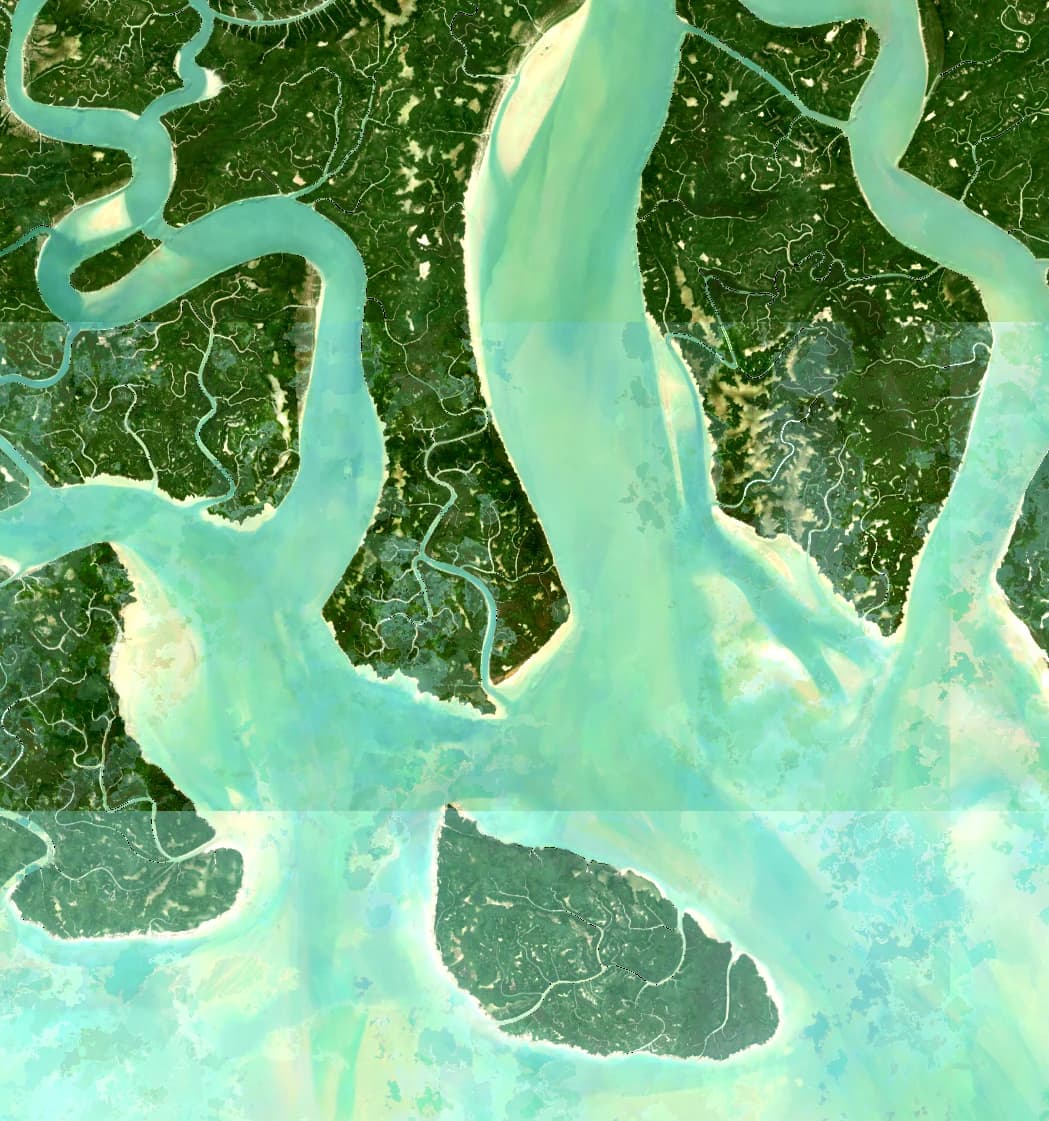
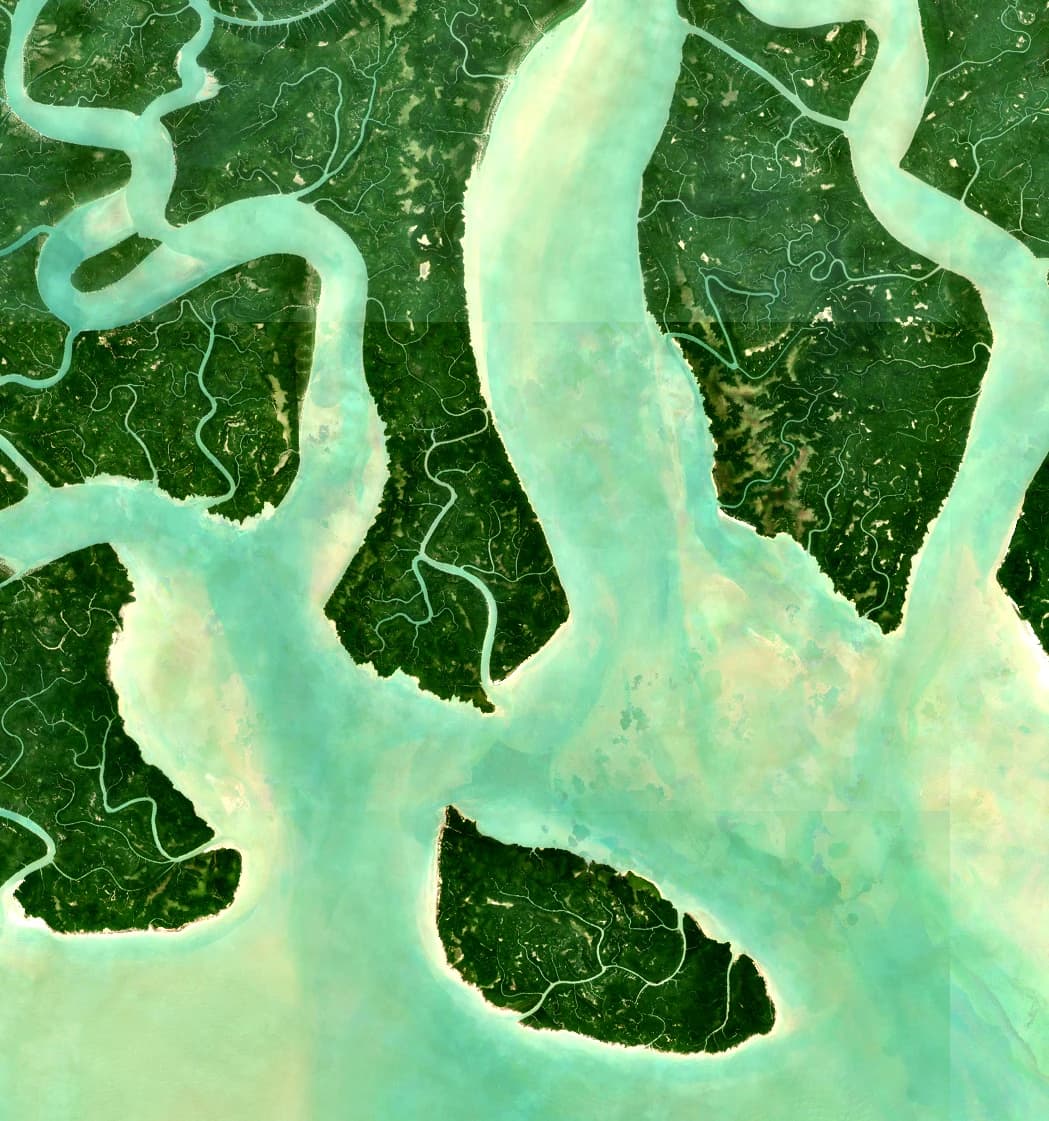
Canopy and shoreline measured separately, by two different indices.
Mangrove eroded
25 patches, land to water
Canopy loss
0.57% of baseline mangrove
Accretion
Water back to land
Net land change
Over five years
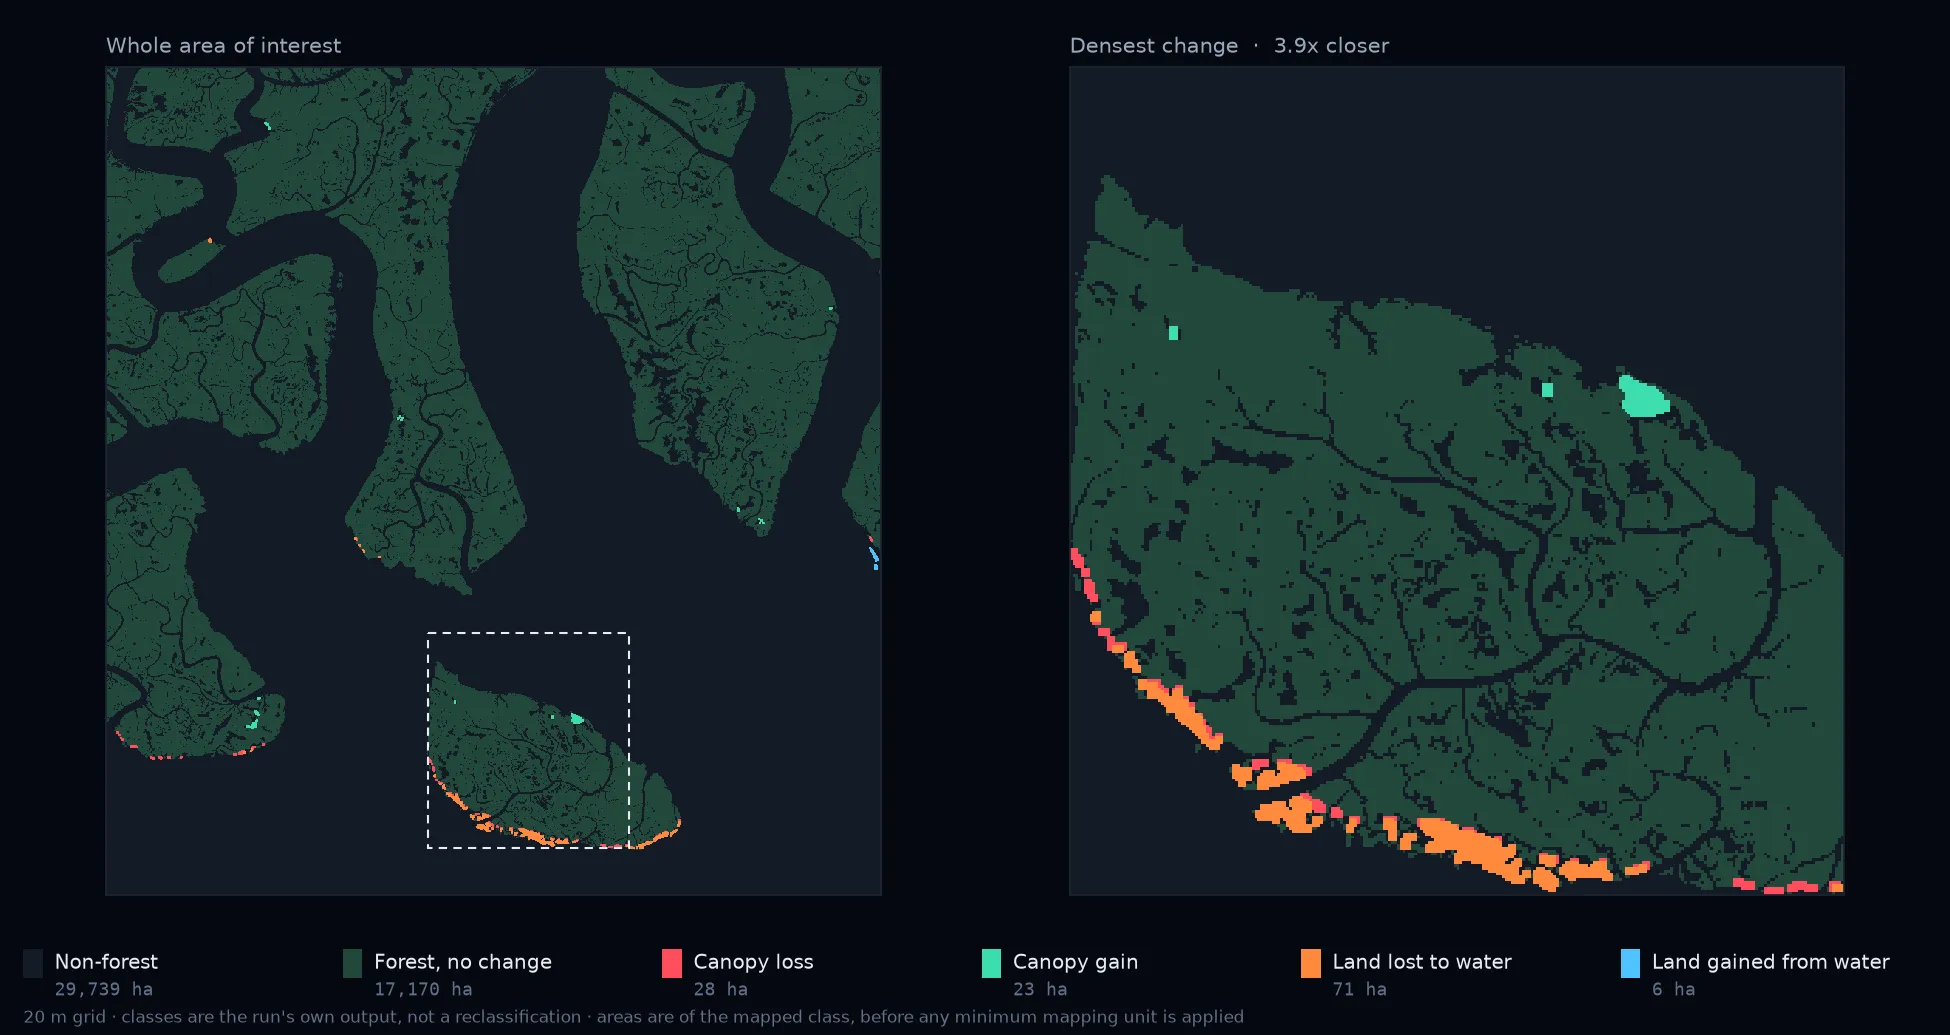
Every pixel in one of six classes, then the densest change at 3.9x. Class areas precede the 0.5 ha minimum mapping unit, so they run above the published figures.
How much the answer moves
MNDWI cut-off between land and water.
| MNDWI cut | ha |
|---|---|
| −0.10 | 59.8 |
| 0.00 (published run) | 71.4 |
| +0.10 | 65.8 |
| +0.20 | 62.4 |
NDVI drop required before a pixel counts as canopy loss.
| NDVI drop | ha |
|---|---|
| −0.10 | 104.4 |
| −0.15 | 101 |
| −0.18 (published run) | 98 |
| −0.25 | 94.4 |
| −0.30 | 87 |
Detecting clearance on the Amazon deforestation frontier
The counterpart to Case 01, run through the same pipeline at the same thresholds: an inland site where change is large and unambiguous, so the detector is shown firing.
- Location
- Rondônia, Brazilian Amazon
- Area
- 22,111 ha baseline forest
- Window
- Jun – Aug 2019 vs Jun – Aug 2024
- Sensors
- Sentinel-2 L2A · ESA WorldCover 2020
- Cadence
- 40 scenes composited, median gap 5 days
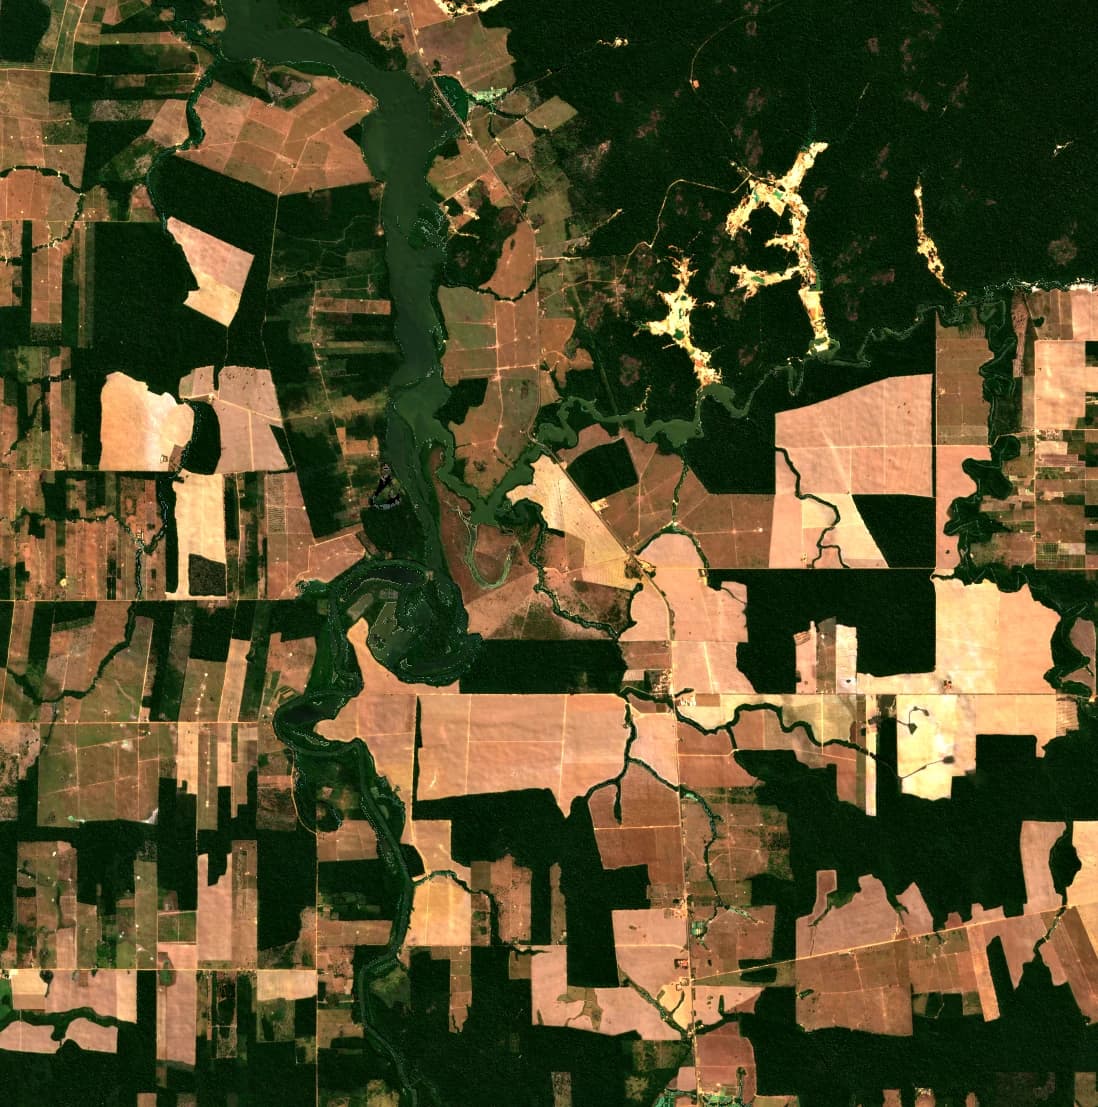
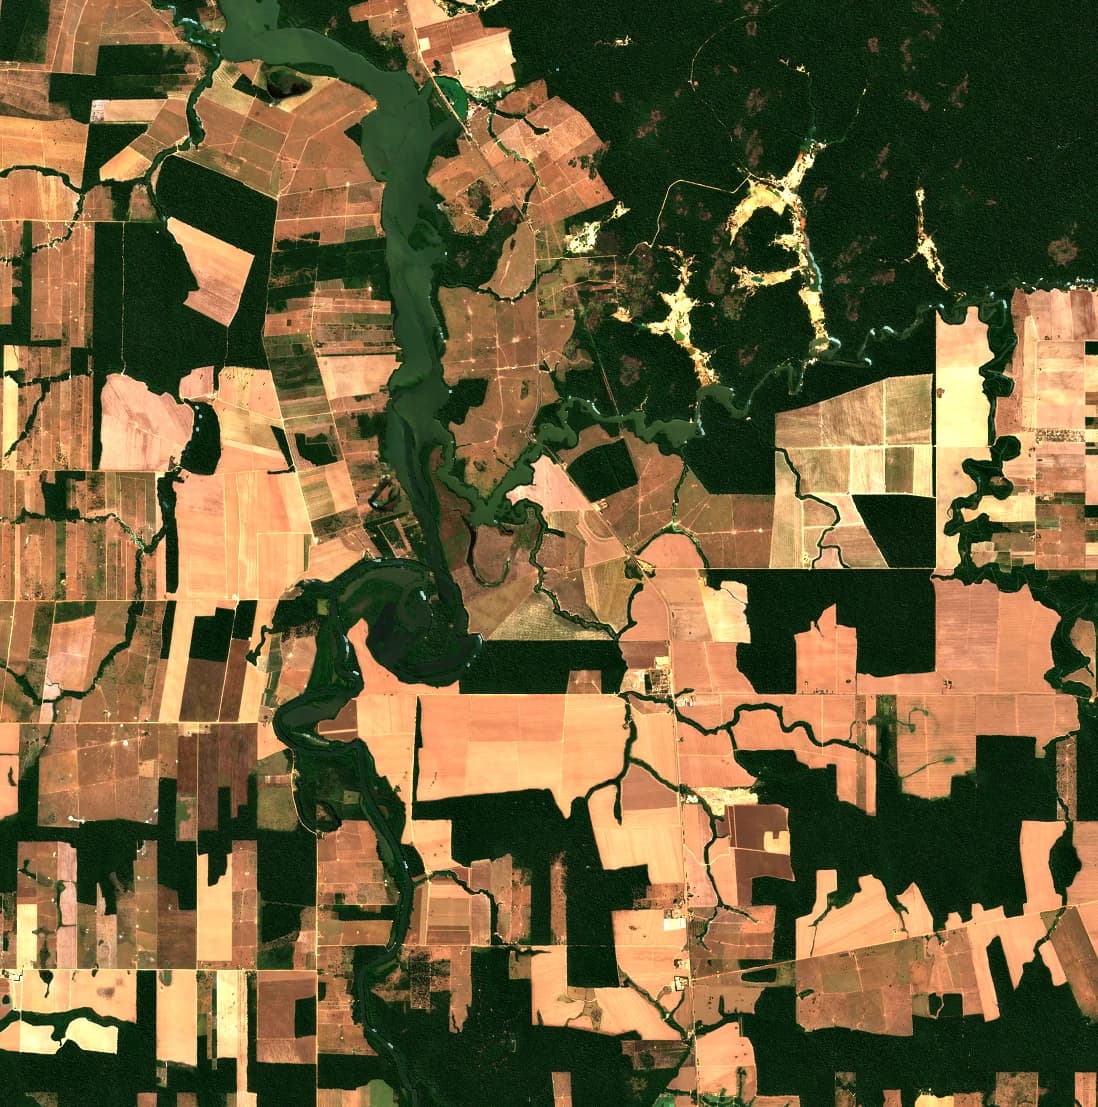
Corroboration is against Impact Observatory / Esri Annual Land Cover.
Loss detected
7.8% of baseline forest
Change polygons
Above the mapping unit
Largest patch
Median patch 2.38 ha
Min. mapping unit
Smallest patch resolved
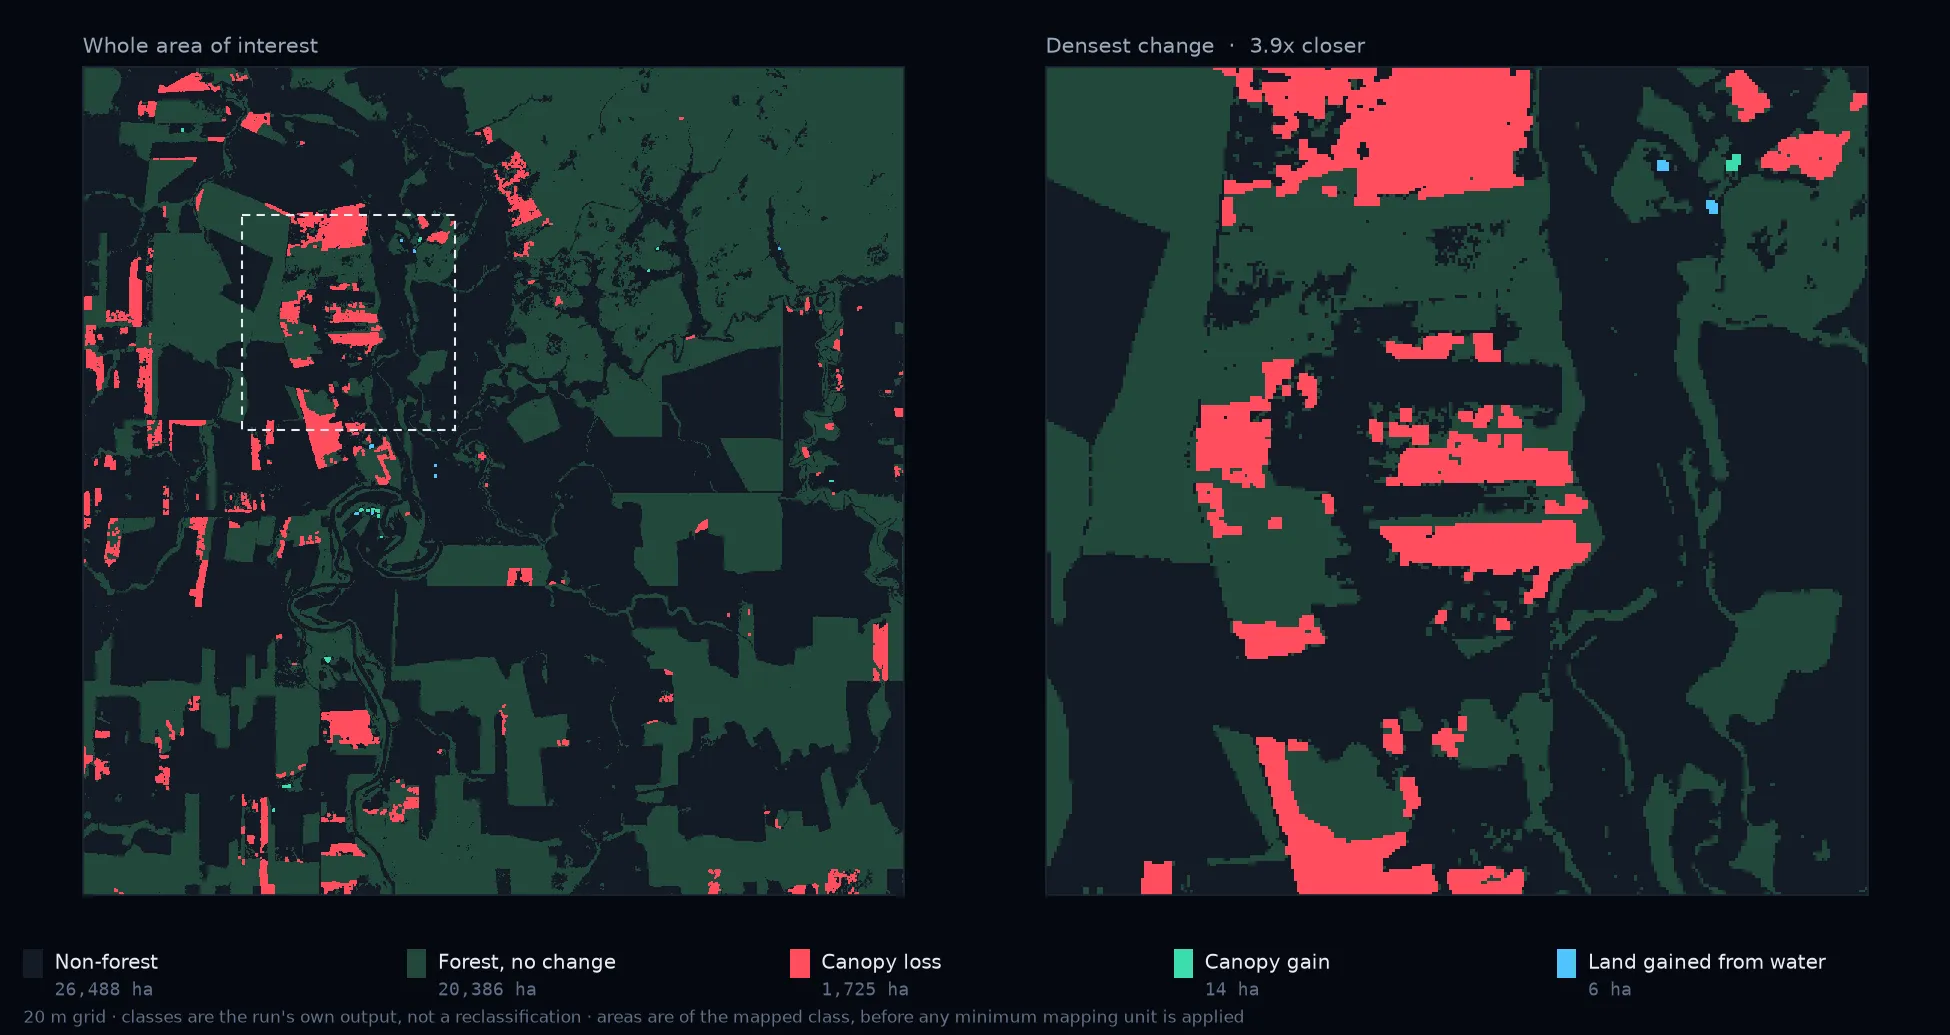
The same six classes as Case 01. Clearance here has geometry — rectangles cut back from access roads — which is what separates real felling from index noise.
440,918 tCO₂e released by the detected clearance
The same 1,724.9 ha of clearance measured above, carried through to carbon.
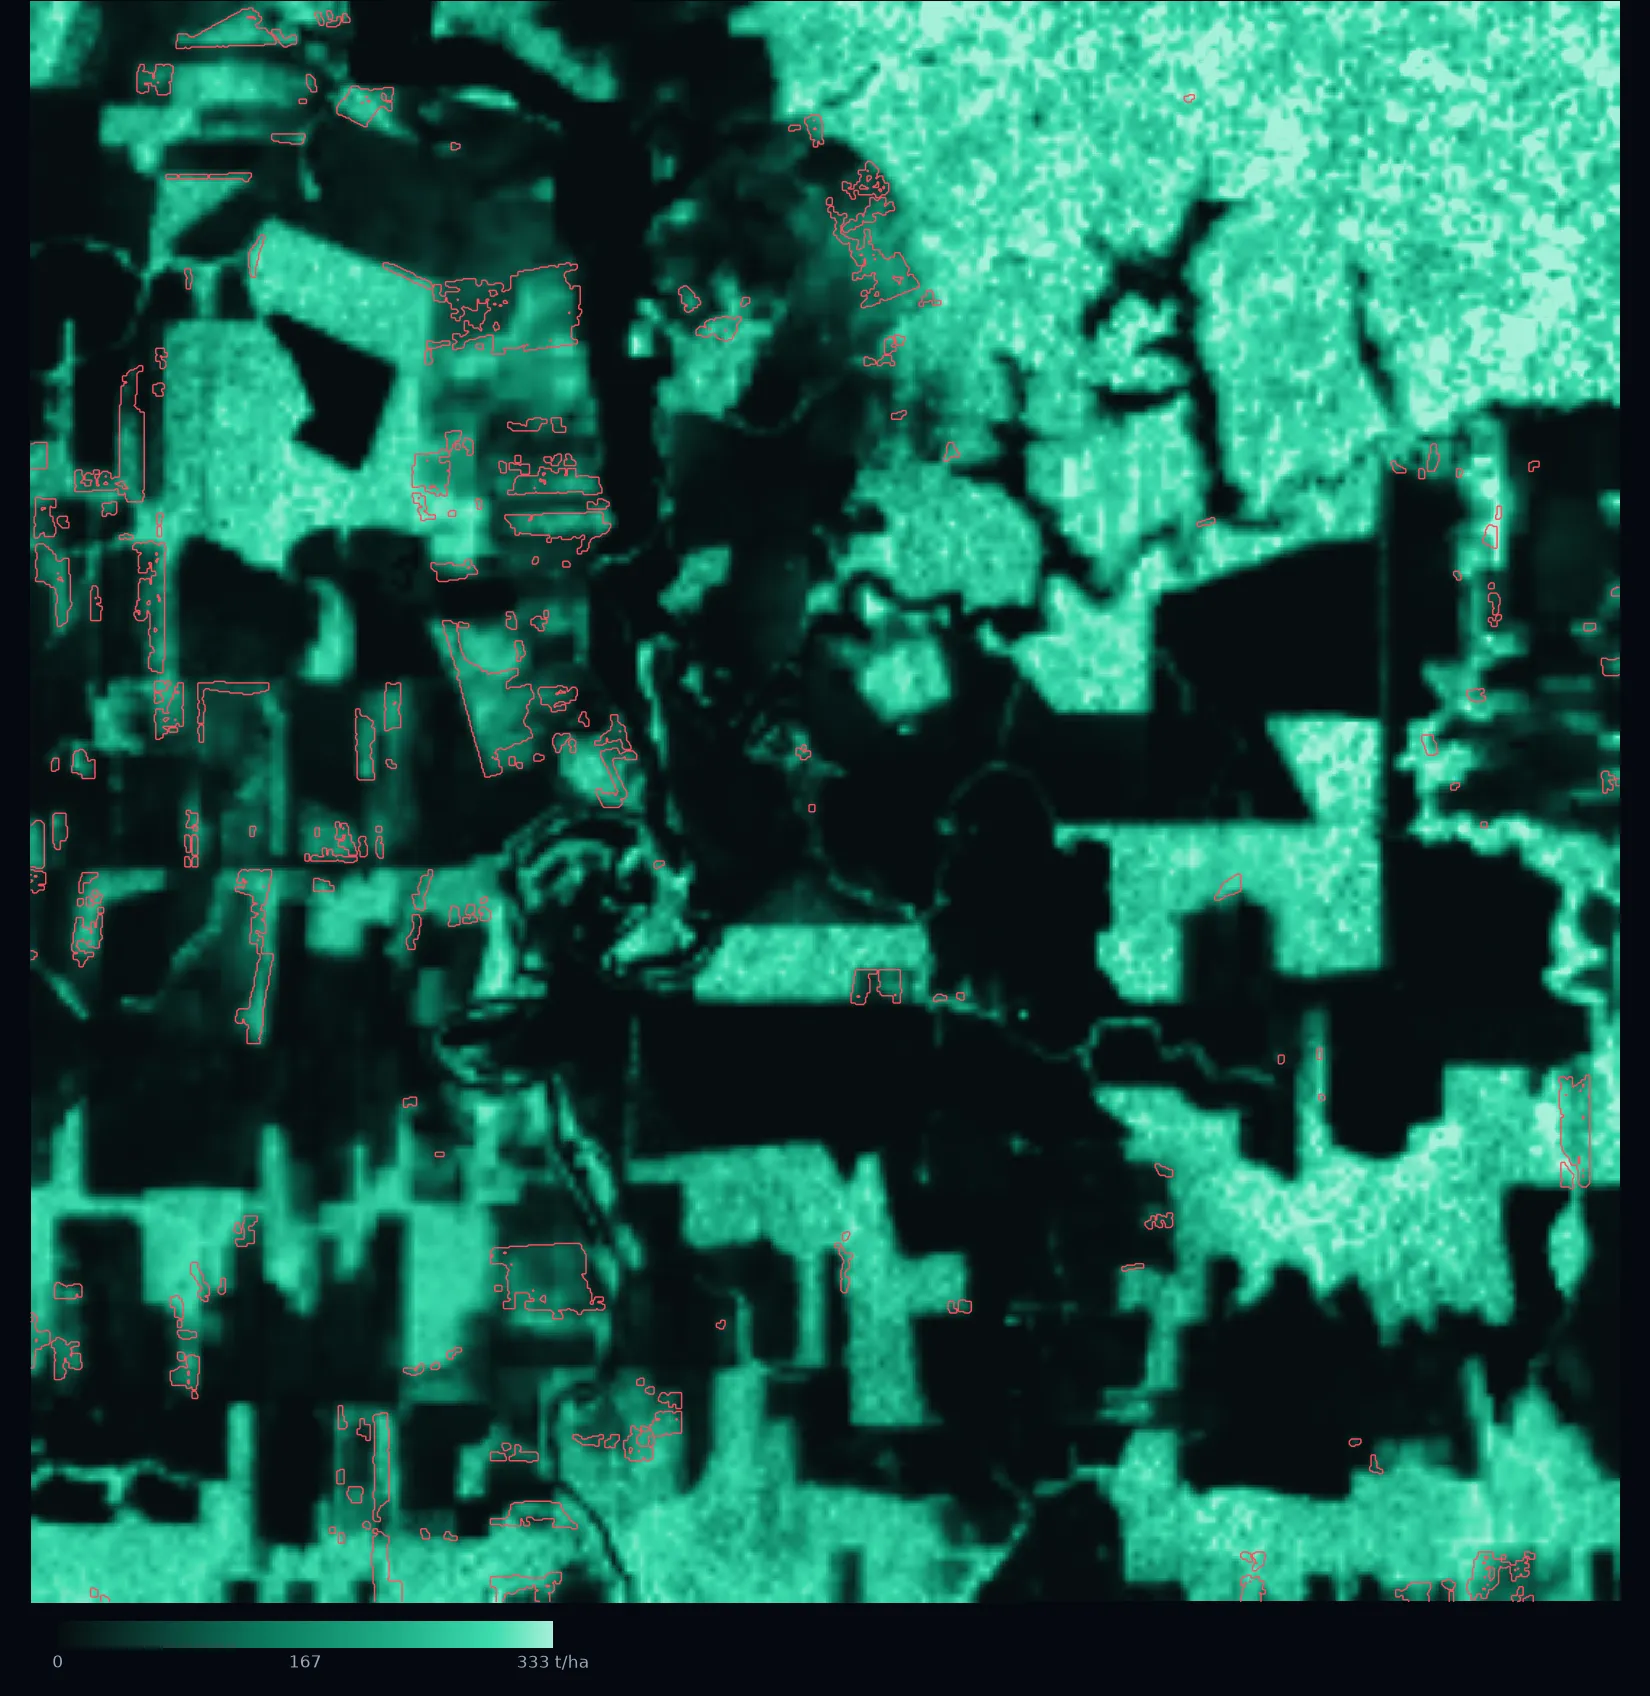
Above-ground biomass from ESA CCI Biomass v5.01, sampled over the detected loss patches. Checked before use: 226.8 t/ha over standing forest here, inside the 150–400 t/ha published range for tropical moist forest.
Standing forest AGB
Validated against published range
AGB in cleared area
Lower than intact stand — edges and prior degradation
Above-ground biomass lost
Over 1,724.9 ha
Released
Practical range 331k – 551k
How much the answer moves
NDVI drop required before a pixel counts as clearance.
| NDVI drop | ha |
|---|---|
| −0.10 | 2,079.4 |
| −0.15 | 1,915.6 |
| −0.20 (published run) | 1,724.9 |
| −0.25 | 1,565.6 |
| −0.30 | 1,401.4 |
The same detection re-run against an NDVI-only forest mask. Without the second condition the page would report 2,580 ha.
Separating a heat wave from a hot country
Not every analysis is a satellite image. Daily maximum temperature for sixteen cities against their own 1991–2020 norm — a percentile, not a fixed threshold, because the choice inverts the answer.
- Location
- 16 cities across Europe
- Area
- ERA5-Land, ~9 km grid
- Window
- 1 – 19 August 2026
- Sensors
- ERA5-Land reanalysis · 1991–2020 baseline
- Cadence
- Daily, ~6 days behind real time
Three or more consecutive days above that calendar day’s 90th percentile.
Peak anomaly, Paris
37.8 °C on 14 August
Milan above p90
One unbroken 11-day run
Seville
Despite the highest peak in the sample
Analysed
30-year baseline each
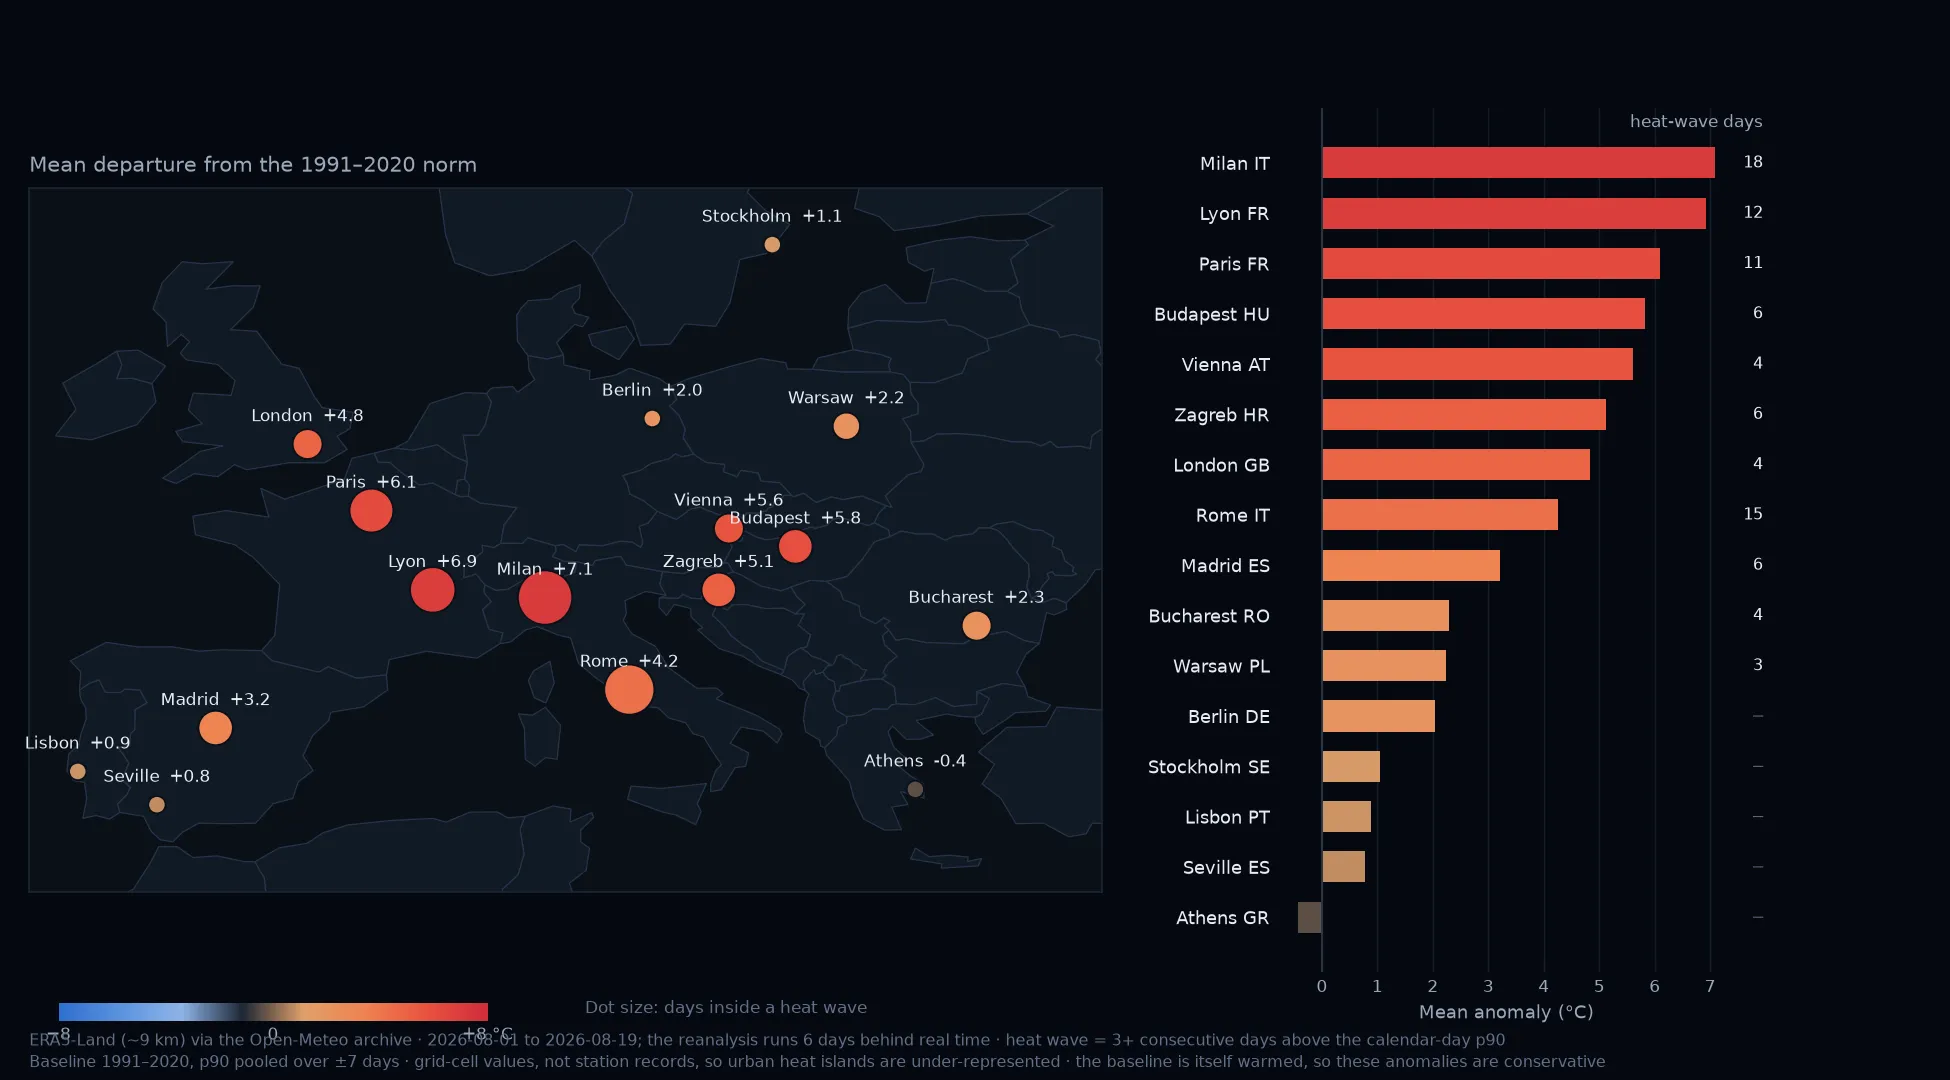
Departure from the 1991–2020 norm, dot size carrying days inside a heat wave. Milan runs +7.1 °C and 18 days; Seville, hottest in absolute terms at 39.6 °C, is +0.8 °C and has none. That inversion is the case.
What this costs, off the map
Third-party reporting on the 2026 European heat season and what it did to electricity demand. The June and July waves, not this August window — reporting, not measurement.
How much the answer moves
Percentile vs. fixed threshold
| City | Peak °C | Mean anom. | Heat-wave days |
|---|---|---|---|
| Seville | 39.6 | +0.8 | 0 |
| Milan | 37.8 | +7.1 | 18 |
| Paris | 37.8 | +6.1 | 11 |
| London | 34.6 | +4.8 | 4 |
Hottest city in the sample, top row, with no heat-wave days at all.
Mapping burn severity through leaf-off in Similipal
Fire observed, not fire predicted. Sal sheds its leaves in exactly the window the fire burned in, and to a burn ratio leaf-off ground and burnt ground look much the same — so correcting for it changes the answer by a factor of three.
- Location
- Mayurbhanj, Odisha, India
- Area
- 37,583 ha forest at baseline
- Window
- Jan – Feb 2021 vs Mar – Apr 2021
- Sensors
- Sentinel-2 L2A · ESA WorldCover 2021
- Cadence
- 11 scenes composited, median gap 2 days
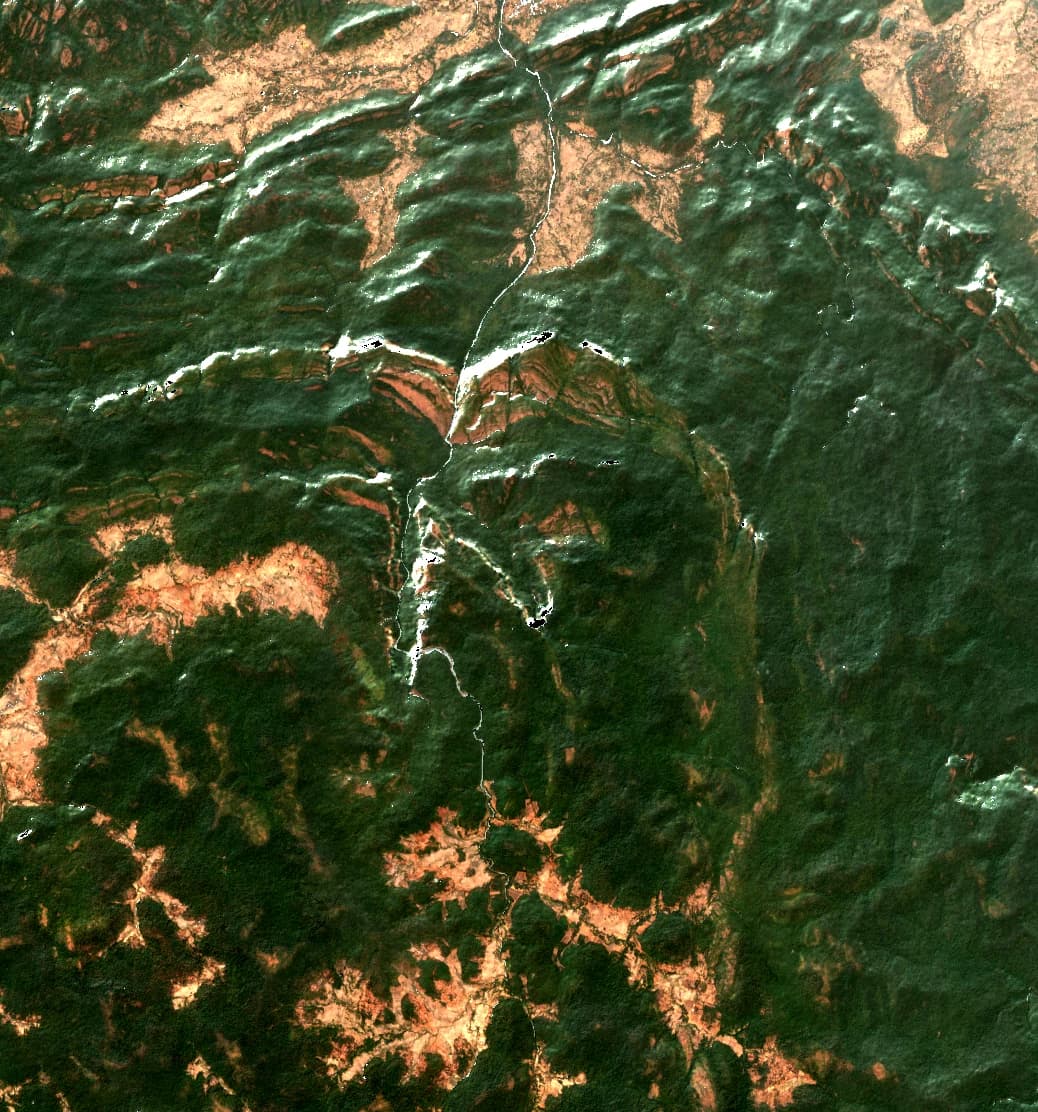
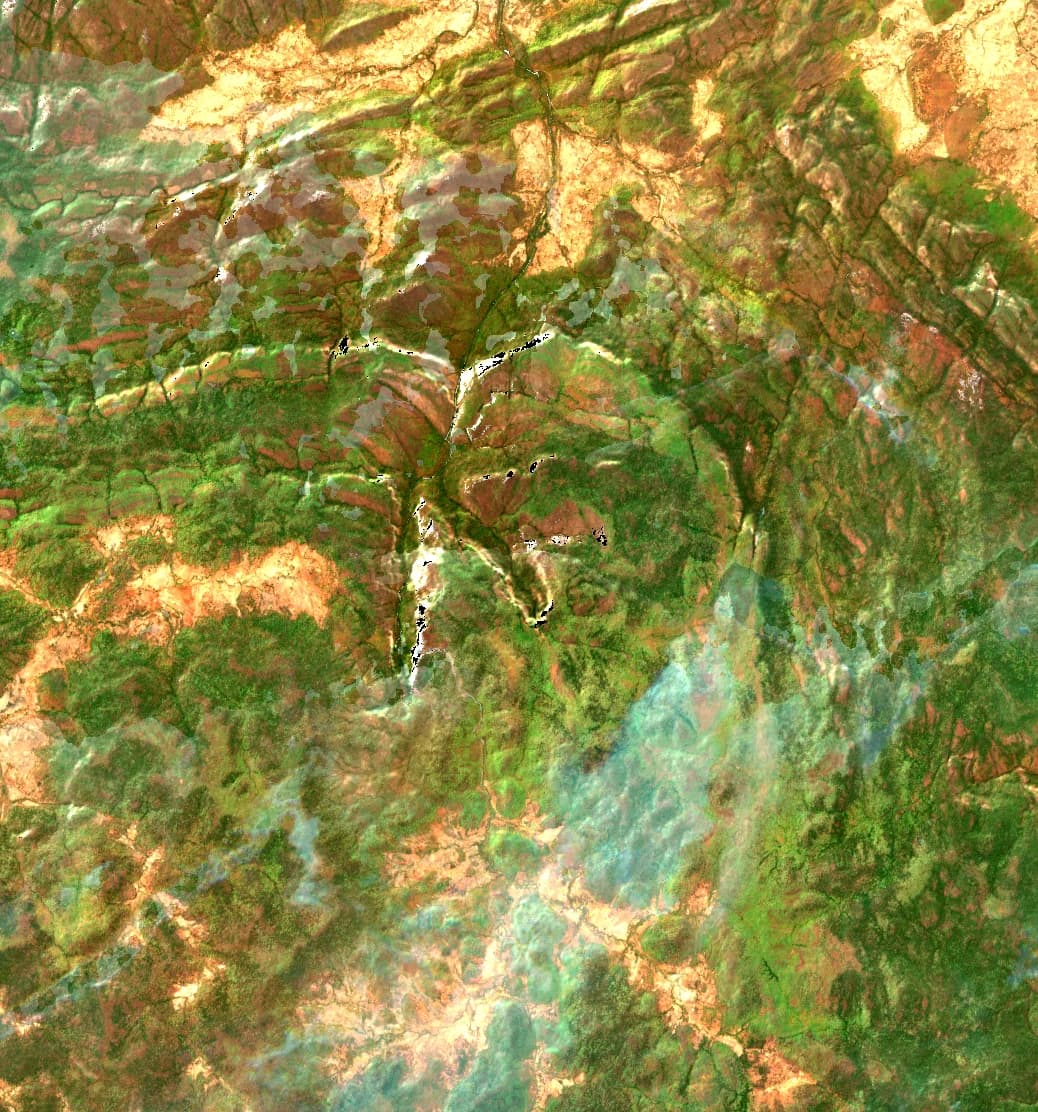
Raw dNBR classes, before the phenology correction.
Burnt area
After the phenology correction
Of observed area
46,112 ha clearly observed
Moderate or worse
dNBR ≥ 0.27
Min. mapping unit
Same floor as every case
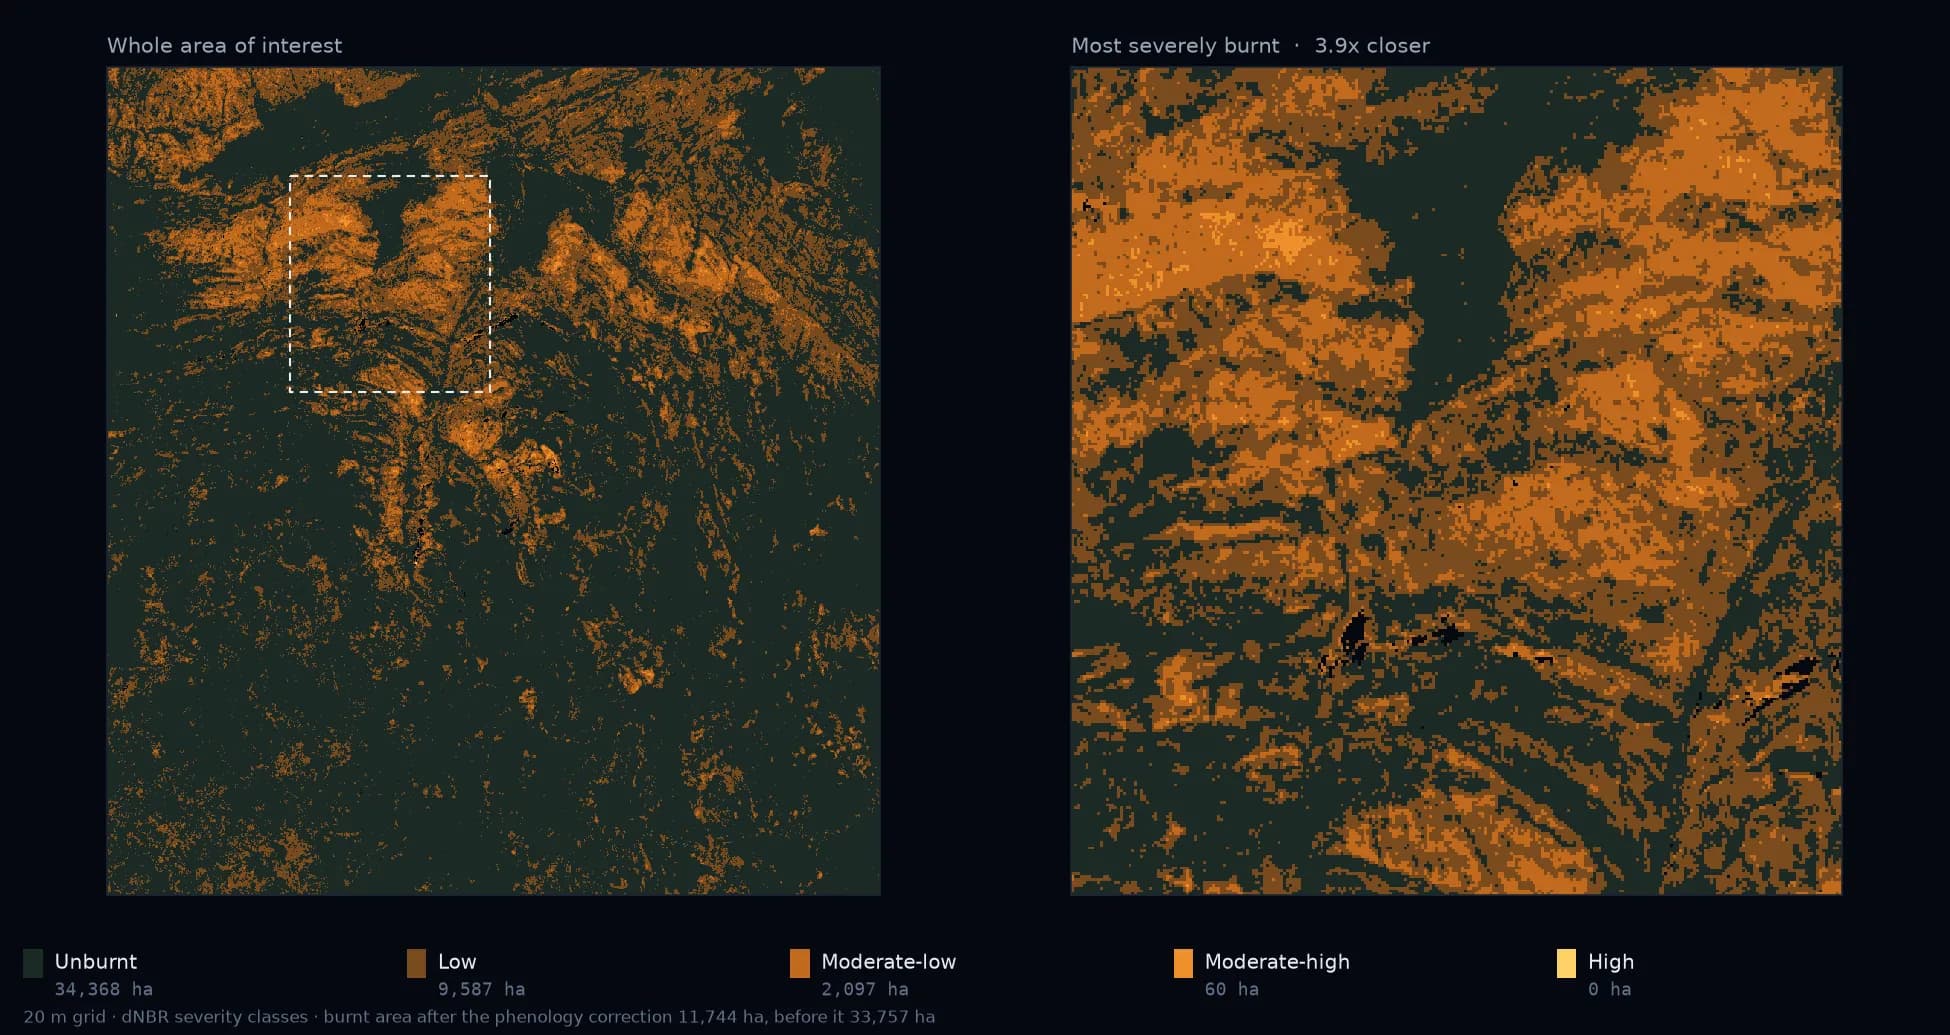
dNBR severity classes, then the most severely burnt block at 3.9x. Class areas are the raw classification; the published burnt area is phenology-corrected, so the two differ.
How much the answer moves
The published run subtracts the median dNBR over unburnt Sal, 0.178. Raw dNBR would put 73.2% of the observed area inside the burn scar; corrected, 25.5%.
Run the same check on your area.
Send a boundary and we will show you what the satellite record already says about it — with the same accuracy figures attached, before you commit to anything.